
|
|
|
|
spikeddem
Jun 9, 2009, 8:44 AM
Post #1 of 10
(8864 views)
Shortcut
Registered: Aug 27, 2007
Posts: 6319
|
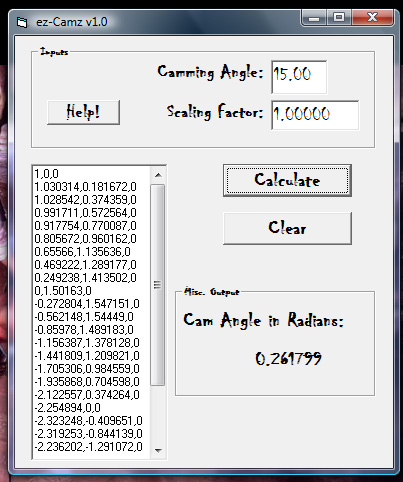
Fortunately I invested more time in the program than in the name. Anyways, I've been playing around with building a cam, and got tired of editing Excel's output to import it into Solidworks.
If you're following this method:
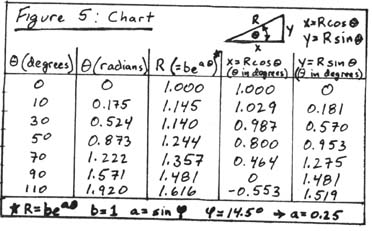
(Click here for Middendorf's full article, from which the above image is borrowed.)
Then my program should be helpful.
What does it do?
It will output all the x,y, coordinates (filling in z as 0) at an accuracy that you are, for the most part, in control of. I say "for the most part," because I made the program round after six decimals since I assumed that the machines used to cut lobes are not accurate to that extent anyways. But I digress, once the output is complete, just cut/copy and paste into notepad, save, and import into your cad program (I know this works for solidworks, perhaps someone else can confirm or reject if the form is the same for other programs?)
Why "# of points per 10 degrees?"
A point of clarification about my ass-backwards "accuracy" system: Essentially, Middendorf's table has 0.5 points per 10 degrees (ignoring his 0 to 10 jump). Doing 10 points per 10 degrees means you're calculating one point for every single degree rotated around. (It seems that to allow room for the axle hole, cams go around about 270 deg, but that was completely just an educated guess on my part. Could someone chime in on that?)
Graphing
It also graphs, and can overlay graphs. Essentially, this allows you to see two things:
1) The difference between camming angles (keeping the # points/10 degrees the same).

or
2) The difference between lobes/axle hole when a less accurate (lower # points/10 degrees) approach is taken (keeping camming angle the same).

Edit: Added strike through on features removed because they were not working properly and were superfluous.
If anyone wants it (either source or .exe), feel free to PM me on here with your e-mail, and I'll send it your way. Not too many sites allow stashing of .exe's, so I can't offer a direct link to download it. 
If you're curious about looking at the source code, know that it's written in Visual Basic 6.0.
(This post was edited by spikeddem on Jun 9, 2009, 7:00 PM)
|
|
|
|
|
brenta
Jun 9, 2009, 1:37 PM
Post #2 of 10
(8815 views)
Shortcut
Registered: Aug 25, 2006
Posts: 50
|
Why is the radius of curvature non-monotonic? Why do you get cumulative errors when you reduce the number of points? Are you integrating the differential equation numerically?
|
|
|
|
|
rocknice2
Jun 9, 2009, 2:46 PM
Post #3 of 10
(8777 views)
Shortcut
Registered: Jul 13, 2006
Posts: 1221
|
i did a similar program but in excel
Inputs include:
Cam Angle
Start Radius
Start angle
Duration and Direction
I keep mine to data point and only 4 decimals.
You barely measure 4 let alone 6 decimals.
I included a small and large gragh


|
|
Attachments:
|
 CAM DATA.jpg
(92.6 KB)
CAM DATA.jpg
(92.6 KB)
|
|
|
CHART.jpg
(78.9 KB)
|
|
|
|
|
adatesman
Jun 9, 2009, 3:23 PM
Post #4 of 10
(8750 views)
Shortcut
Registered: Jul 13, 2005
Posts: 3479
|
|
|
|
|
|
spikeddem
Jun 9, 2009, 6:57 PM
Post #5 of 10
(8706 views)
Shortcut
Registered: Aug 27, 2007
Posts: 6319
|
brenta wrote: Why is the radius of curvature non-monotonic? Why do you get cumulative errors when you reduce the number of points? Are you integrating the differential equation numerically?
Just as I crawled into bed last night, I realized that it doesn't make any sense that there would be cumulative error. In a sense, there isn't. The error is in the graph, and not the data. I used straight lines to connect each point of data on the graph, rather than a fitted curve. I don't know why, but I'm sure this is the reason.
I'm not using the logarithmic spiral equation for this program. (Well, not directly.)
rocknice2 wrote: i did a similar program but in excel <snip>
That's where I initially had everything, but got sick of adding commas into the .sldcrv file for importing into solidworks.
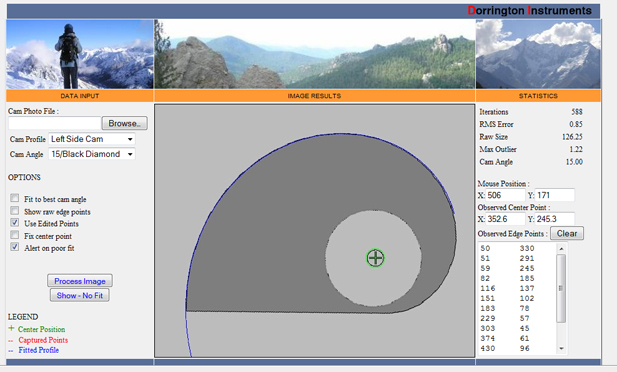
adatesman wrote: Oh, and nice attempt spikeddem, but I'm not quite following why your center point is moving or the curves not matching when using fewer points per 10 degrees. And the plotted curves look rather odd... -a.
Yeah, see above about the graphing problems. 
Here's a curve that was produced with the program, imported into solidworks, and run through the Cam Fitter. So, it looks like the data is actually good, just the graphing was crap.
|
|
|
|
|
rocknice2
Jun 9, 2009, 7:10 PM
Post #6 of 10
(8693 views)
Shortcut
Registered: Jul 13, 2006
Posts: 1221
|
I'm using Gibbs cadcam and I just import a straight text file like this:
X Y
1.0000	0.0000
1.0174	0.0890
1.0273	0.1811
1.0291	0.2757
1.0225	0.3722
1.0072	0.4697
0.9830	0.5675
0.9496	0.6649
0.9070	0.7610
0.8551	0.8551
0.7939	0.9461
0.7235	1.0333
0.6441	1.1157
0.5561	1.1925
0.4596	1.2628
0.3552	1.3257
0.2434	1.3805
0.1248	1.4262
0.0000	1.4622
-0.1302	1.4878
-0.2649	1.5021
Then pass a curve though all the points
|
|
|
|
|
spikeddem
Jun 9, 2009, 7:19 PM
Post #7 of 10
(8680 views)
Shortcut
Registered: Aug 27, 2007
Posts: 6319
|
Back when I did a search through the forums, first way I found, for Solidworks, was by Aric, and he said to have them delineated by commas. If there's another way, then I really wouldn't need this program at all, but oh well. 
|
|
|
|
|
adatesman
Jun 9, 2009, 7:22 PM
Post #8 of 10
(8678 views)
Shortcut
Registered: Jul 13, 2005
Posts: 3479
|
|
|
|
|
|
brenta
Jun 9, 2009, 10:54 PM
Post #9 of 10
(8640 views)
Shortcut
Registered: Aug 25, 2006
Posts: 50
|
spikeddem wrote: So, it looks like the data is actually good, just the graphing was crap.
|
|
|
|
|
rocknice2
Jun 9, 2009, 11:11 PM
Post #10 of 10
(8630 views)
Shortcut
Registered: Jul 13, 2006
Posts: 1221
|
adatesman wrote: I think that's the result of Solidworks requiring a comma delineated format for its imports and Gibbs can make due with tab delineated. Six of one, half dozen the other really. BTW Rocknice- I posted your spreadsheet/program into the software thread. The attachment limit is 150k and it zipped down to 44k and went on no problem.
U Da Mann
|
|
|
|
|
|


